 AI WORLD HQ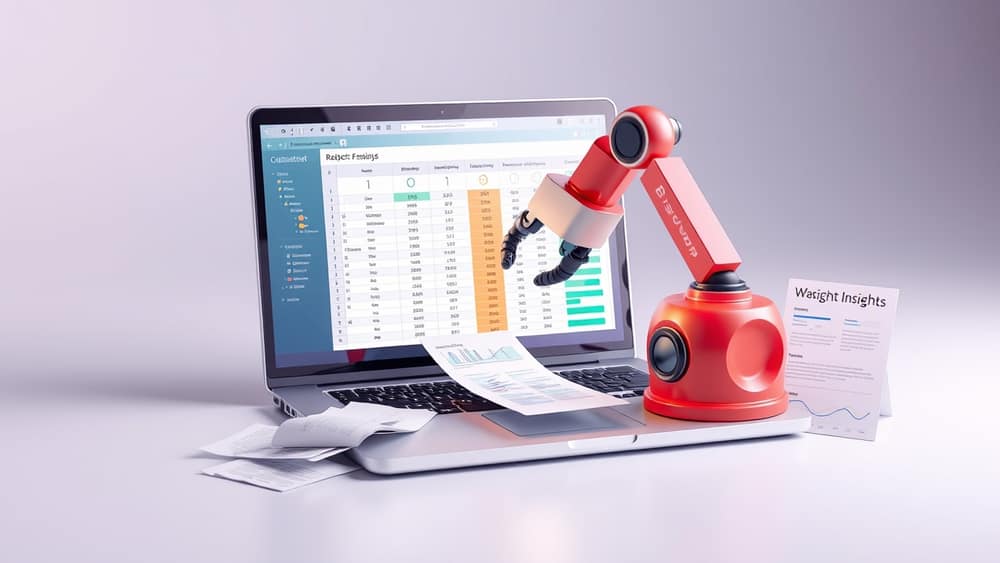
How to Use AI to Make Sense of Confusing Data (Without Being a Data Scientist)
Hook: You just got a spreadsheet from work with 500 rows of sales figures, customer feedback, and delivery times. Your eyes glaze over before you even scroll past the first page. Sound familiar? AI can help you spot patterns, highlight what matters, and even suggest what to do next—without needing a degree in statistics.
Start with a simple question
Before you open any tool, ask yourself: What am I trying to find out? For example:
- “Which of my products sold the most last month?”
- “Why did customer complaints spike in March?”
- “What’s the average delivery time for orders over $100?”
This question becomes your prompt—the instruction you give to the AI. Think of a prompt like a clear instruction to a helpful coworker: “Hey, look at this data and tell me which product had the highest sales in May.”
Upload your data and let the AI analyse it
Most AI tools today can read files like spreadsheets (Excel, Google Sheets, CSV) directly. Here’s how:
- Open your AI assistant (like ChatGPT, Gemini, or Claude).
- Upload your file using the paperclip or upload button.
- Type your question in plain English: “This is my sales data from last year. Can you tell me which product had the highest sales in each month?”
The AI will process the data and give you a clear answer—often with a simple chart or summary.
🔍 What’s happening here? The AI uses a large language model (LLM)—think of it as a super-smart reader that can understand tables and text. It doesn’t “know” the data beforehand; it just reads what you give it and finds patterns.
Ask follow-up questions to dig deeper
Once you have a basic answer, don’t stop there. Ask the AI to explore further:
- “Can you show me a chart of sales by month?”
- “Which region had the lowest sales in Q2?”
- “Is there a connection between delivery time and customer satisfaction?”
The AI can generate simple charts, highlight trends, and even suggest possible reasons—like pointing out that sales dropped every time delivery times increased.
⚠️ Watch out for “hallucinations” Sometimes AI confidently makes up connections that aren’t real. Always double-check surprising results with a quick search or your own common sense.
Turn insights into action
Now you have clear insights. Use them to make decisions:
- If one product consistently sells well, consider promoting it more.
- If delivery delays hurt sales, talk to your logistics team.
- If customer complaints rise in summer, plan extra support during peak months.
You don’t need to be an expert—just someone who can ask the right questions and act on the answers.
Wrap-up
You don’t need to be a data scientist to understand your data. With a simple question, a file upload, and a few follow-up prompts, AI can turn confusing numbers into clear insights—helping you make smarter decisions every day. Try it today: upload a small dataset and ask the AI what stands out. You might be surprised by what it finds.